TLMscope help
A quick tour of what each view shows and how to get the most out of it.
Updated
First steps
- Drop one or more
.TLMfiles onto the start page, or click to choose them. You can add more files any time. - Pick a session in the list on the left. On a phone the list is a picker at the top. Each power-up of the receiver is one session.
- “Flights” shows real flights only, “All” also ground tests and short power-ups. With several models loaded, you can limit the list to one model.
- Above the list you see the total flight time of the loaded flights, for the chosen model. “Export as CSV” saves the sessions of the list as a spreadsheet file, made in your browser.
Plain view and details
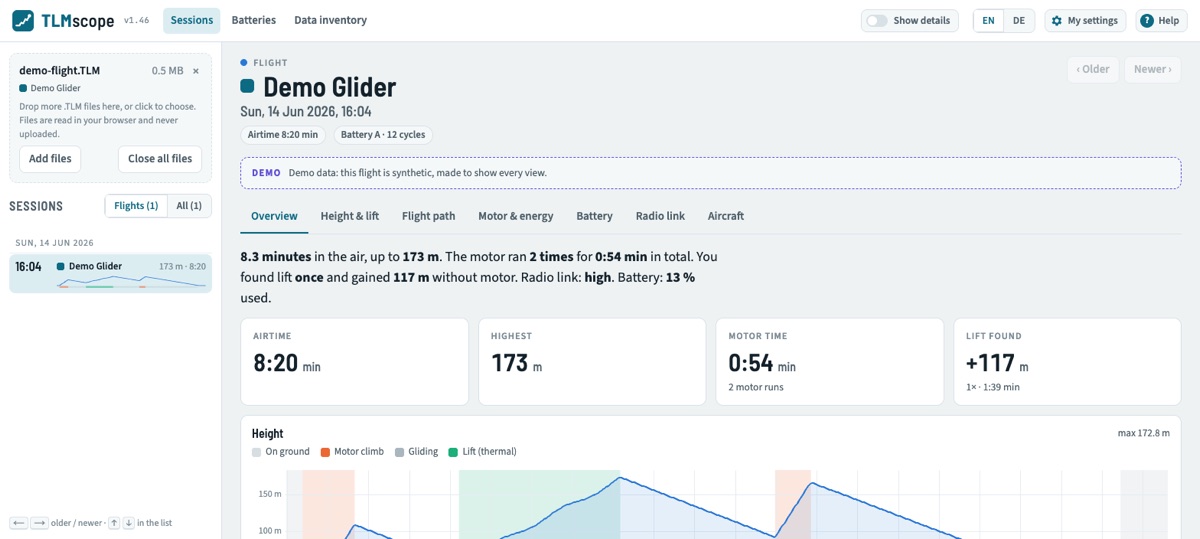
By default you see plain-language summaries and four-level ratings, for example Critical, Weak, Normal and High. Switch on “Show details” at the top right for exact values, more charts and the limits behind every rating. The reasons for the limits are explained in Understand your Spektrum telemetry. The cards of the overview link to the page with the detail behind them and put the cursor on the moment behind the rating, for example the weakest signal.
The tabs of a session
- Overview: a summary sentence, key numbers, the height profile with motor climbs, glides and lift, and the health check, whose cards link to the details.
- Height & lift: climbs, lift found and the glide; without a vario, the height from GPS.
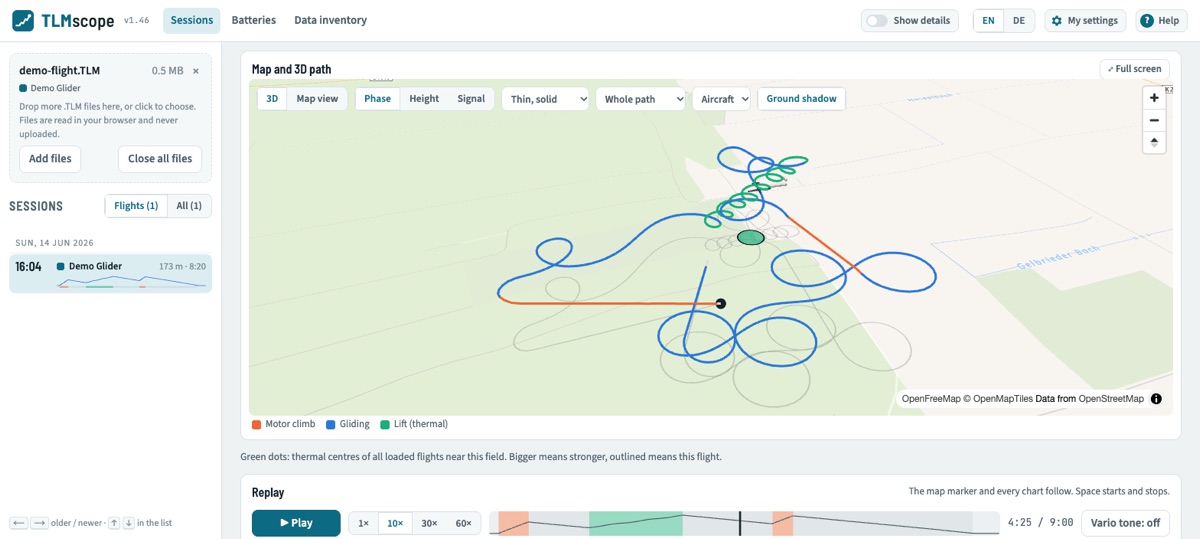
- Flight path: the path on a map and in 3D with a replay, and the ground speed (needs a GPS sensor).
- Motor & energy: motor runs, current, charge used and the climb efficiency.
- Battery: charge level, cell voltages and the voltage sag that gives the internal resistance.
- Radio link: signal strength, frame losses and holds over time, and the signal against height. Click a level under the timeline to show only it and step through it.
- Aircraft: temperatures, receiver and BEC voltage, loads, the flight modes over time and the stabilization per flight mode with the AS3X gain.
- Raw data: all decoded sensor streams, shown with “Show details”.
Flight path and replay
With a GPS sensor the flight path is shown on a map in 3D. Choose between the 3D view, the map view from above and the follow view (beta), where the camera flies behind the model. Hold the right mouse button and move up or down to tilt the view. The mouse wheel scrolls the page; Ctrl and the wheel (⌘ on a Mac) zoom the map, and on a phone two fingers move it. The replay plays the flight back at up to 60 times speed; the model marker, every chart and an optional vario tone follow. Space starts and stops it, and a full-screen mode gives the map more room. The map options set the colour, the line style, the model shown in the replay, a ground shadow and the relief (beta). TLMscope keeps them from flight to flight.
Batteries and data inventory
- Batteries groups the flights by Spektrum Smart battery. Each pack shows its charge cycles, its condition, a trend of the internal resistance and an estimate of the cycles left. The list of sessions of a pack opens with one click.
- Data inventory lists everything found in the loaded files, including the parts that are not understood yet.
Keys, language and privacy
- Arrow left and right move to the older or newer session; arrow up and down move through the list while it has the focus.
- Space starts and stops the replay; Esc closes the full-screen mode.
- EN and DE at the top right switch the language.
- Files are read in your browser and never uploaded. Only the map loads map images from OpenFreeMap, and the relief (beta), when switched on, elevation data from Amazon Web Services.